Aston Villa’s Three-Quarter Season Progress Report
By Kristoffer Rasmussen
Aston Villa’s progress levels off as the season enters its final third.
It’s been a slightly sobering past few weeks since last time we charted Aston Villa’s fortunes at the mid-way part of this season, as the pendulum of good fortune has swung both ways for Villa since. The words of The Dude of The Big Lebowski come to mind: It´s been “Strikes and gutters, man, strikes and gutters”.
Positives can be taken from the approach to some games such as against Leeds United, where Dean Smith showed his willingness to change tactics and team selection. The fact that the introduction of a tweaked formation to something like a 4-1-4-1 and the introduction of Nakamba and Ramsay, really working in Villa’s favour, will have confirmed to Smith that it´s worth mixing things up sometimes – and that could bode well for the remainder of the season.
With recent injuries to Matty Cash and Jack Grealish, and the loss of form for others such as Ross Barkley, Villa’s fluidity as a team and their loss of clinical edge is a concern. While one win in their last seven games has failed to build a foundation for a realisitic European charge, Villa will still seek a positive end to the season to carry the momentum of improvement into next season.
Will the return of Grealish also spark Barkley back into life? 4-4-2? 3-4-1-2? #Bigmanbacksoon? Three CB´s? Villa must find the right formula or perhaps further evolve the ability to be tactically flexible for different games and be more proactive in-game.
Progress chart

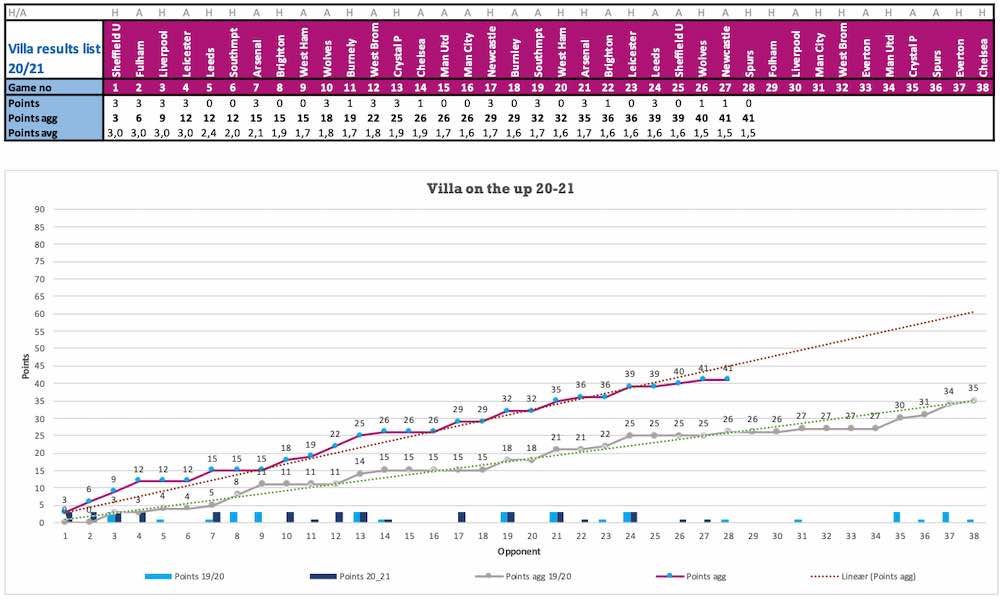
Looking at the average points per game, there is still obviously decent progress on last season, if not at the level that we might have hoped for based on the start of the season. The results have been a bit too inconsistent. Wins and losses have alternated and caused weekly mood swings for Villans.
However, the points average hasn’t changed that much since the extraordinary opening spell where the initial four consecutive wins caused the points average to soar to an unsustainable height. After game nine, Villa’s average points was 1.7 points per game, and as of now, after game 28, it is 1.5, where it seems to have stabilised.
Throw in the missed opportunity against 10-men Sheffield United and you see, it’s pretty disappointing form, when you’re actually consider you’re comparing such results to a team that finished on only 36 points last season.
The question is if this is the actual level for Villa this season? We would end the season just shy of 60 points and probably at the better end of the mid-table – a fair outcome perhaps considering the season until now?
Fixture Chart
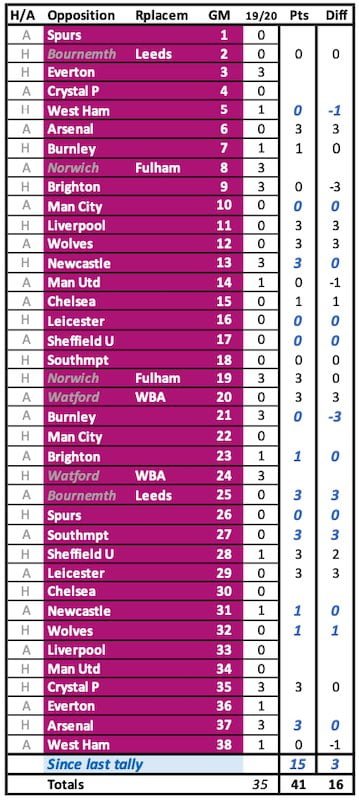
You get a real sense of the missed opportunity that this season was for Villa, when you compare the results in some fixtures to last season’s. A double over Arsenal, meant Villa had three extra points than they achieved in two fixtures against the Gunners last season. Notable gains include four points against Wolves, three against Leicester City and at least three in games against Liverpool.
With that in mind, just a single point earned in each of the home and away ties against Brighton and Burnley, will be seen as six big points dropped on last season. Losing twice to West Ham (and being minus two points down on last season), certainly could have been bettered when you consider the actual games.

While Villa are 14 points ahead of last year’s results, they are only three points up since the last time we published a progress report in the first week of January. So, in the corresponding fixtures to last season in 2021, Villa have been on a similar level to the team that barely escaped relegation.
Points Average Comparison
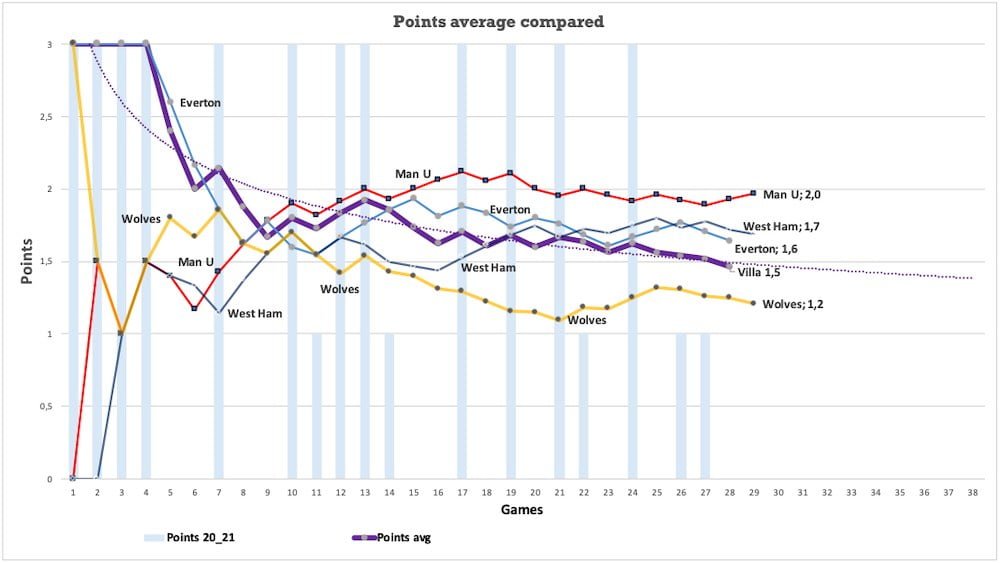
The context of the chart is that a points average per game of around two would put a team in contention for the top spots, whereas a points average below one would put a team in serious danger of relegation as proved by Villa last season.

The chart shows the points average for Villa (bold claret graph) and of four other teams: Manchester United, West Ham, Everton and Wolves. The points gained by Villa are indicated by the blue columns.
Granted, United are a cut above Villa at this time but the others are teams Villa could and should be mixing it up with.
At a glance, the chart reveals a clear tendency for the points average to be very volatile in the early stages and then setting – in this case at about ten games in. After that the changes become less dramatic.
The chart shows at least a couple of interesting things about Villa’s season.
Firstly, the trend is slightly downward for Villa over the course of the season. This is arguably in sync with the sentiments among Villa supporters.
Secondly, the chart shows that Villa aren’t very far off the pace. If they hadn’t thrown away the points against the likes of Burnley, Brighton and Sheffield United, they would have easily been in the mix with the likes of Everton or West Ham – which is frustrating, in terms of opportunity really was knocking.
The players have clearly been aware of this, judging by recent interviews, so what can they get from the remainder of the season?
It is hard to see any reason why Dean Smith shouldn´t take a progressive approach in some way, whether it be tactical experiments with an eye to next season or in assessing what improvements he needs to build a more resilient and consistent version of his Villa team
UTV

